Tách Nhạcv0.14.0
Ready

Spectrogram viewer online

What does a spectrogram tell you about an audio file?

Updated:

Drag & drop a file here, or click to choose

mp3, wav, m4a, ogg, flac… up to 200MB

No file handy?

The spectrogram viewer settings panel: display style, color theme, frequency scale, FFT window size, gain and dynamic range
Zoom, minimap, region loop, color themes, FFT size, gain and dynamic range: fine-tune the spectrogram right in your browser.

Looking at the plot without knowing what it says?

The tool draws the picture; reading it is still your job. If you want someone to confirm whether a file is genuinely lossless, which band a mix is failing in, or how much vocal is left in an instrumental, our team will look and tell you.

Ask the team to look

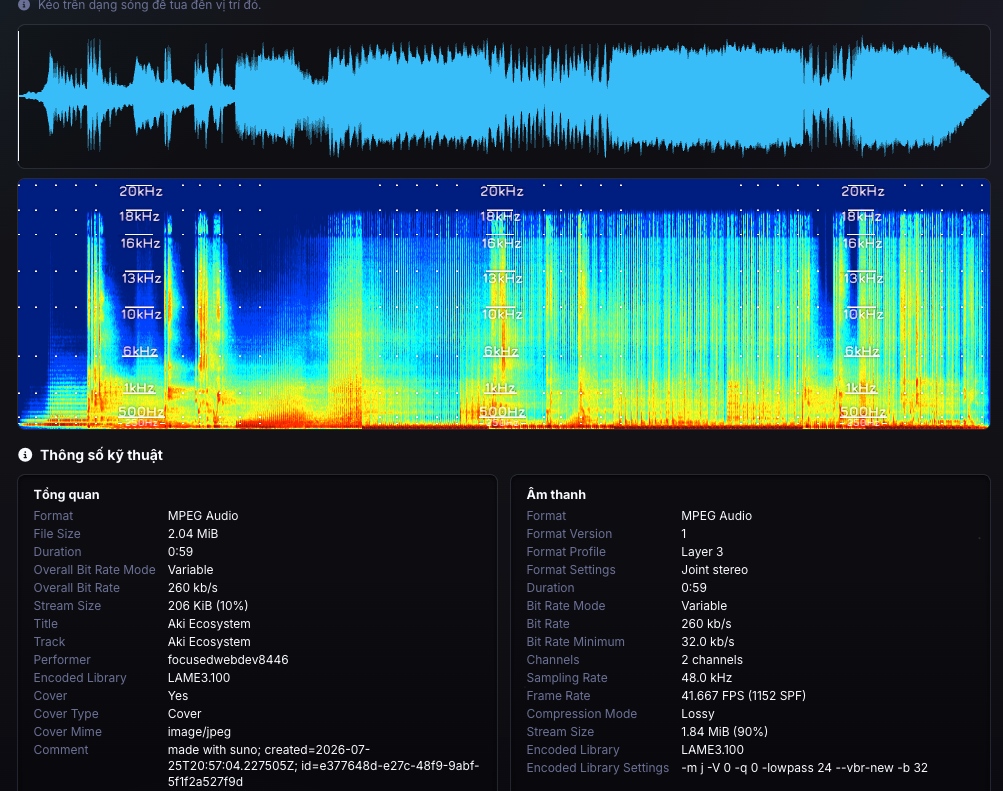
A spectrogram plots a file across two axes: time and frequency, with color showing how much energy sits at each frequency at each moment. It shows things a plain waveform cannot: how much high-frequency content a file actually has, where it gets cut off, and what is genuine signal versus background noise. The tool on this page reads the file directly in your browser; nothing gets uploaded anywhere.

What is a spectrogram?

A spectrogram is a plot showing which frequencies an audio file contains, how strong each one is, and how that changes over time. Time runs along the horizontal axis, frequency in Hz along the vertical axis, and the colour at each point encodes the energy at that frequency at that instant. It is computed by running a Fourier transform over a series of short consecutive slices of the recording. Put simply: a waveform answers how loud, a spectrogram answers what the sound is actually made of.

How is a spectrogram different from a waveform?

A waveform only plots amplitude (loudness) over time: one axis is time, the other is how loud or quiet the signal is, with zero frequency information. A spectrogram adds a third dimension: the horizontal axis is still time, the vertical axis is frequency in Hz, and the color or brightness at each point shows how much energy sits at that exact frequency at that exact moment. A waveform tells you which parts are loud or quiet. A spectrogram tells you which parts have bass, which have high-frequency detail, which have hiss, or which frequency range has nothing in it at all.

How can you tell if a music file has been hi-cut?

Look at the top edge of the spectrogram. If the energy stops abruptly in a flat horizontal line, typically somewhere around 16 to 19kHz, that is evidence of a brickwall filter, usually from a low-bitrate mp3 (128kbps, 192kbps) or any lossy-compressed source rather than a true original recording. A genuinely lossless file or a high-bitrate lossy file usually shows a spectrum that extends further, with energy tapering off gradually instead of stopping dead in a flat line. This is the most common way people spot a "fake FLAC" (a lossy file repackaged into a lossless container to look higher quality than it actually is) or a track that was upsampled from a lower-quality source. One caveat worth stating plainly: a cutoff alone is evidence, not absolute proof. Some genuine masters have a natural high-frequency rolloff from the mix or mastering choices, so it is worth combining this reading with what you already know about the file's source.

How do you actually read a spectrogram: axes, color, and what a cutoff looks like?

The horizontal axis is time, the vertical axis is frequency in Hz (low at the bottom, high at the top). Brighter or more intense color means more energy at that frequency; dark or near-transparent areas are close to silent. A bright horizontal line sitting at one fixed frequency is usually hum. A sudden bright block that spreads across the entire frequency range for a brief instant is usually clipping or a loud transient. A hard cutoff, as described above, shows up as a flat horizontal boundary near the top, a clean line separating signal from an empty band above it.

What else is a spectrogram useful for beyond checking file quality?

Plenty. In mixing and mastering, it helps spot clipping (a flat-topped waveform shows up as an abnormal broadband smear in the spectrogram), judge the noise floor (background hiss appears as a faint, even haze across the whole frequency range), or find a harsh resonant frequency (an unusually bright, persistent line sitting at one specific frequency throughout the track). If you separate stems first, the spectrogram of an instrumental track will clearly reveal any leftover vocal bleed, usually a faint ghost pattern that follows the rhythm of the original melody. Even without hunting for a specific problem, looking at a spectrogram is simply a visual way to understand how a song is arranged: which sections are dense with instruments and which are stripped back to a bare vocal.

Who should use this spectrogram viewer?

  • Anyone checking whether a downloaded file is actually lossless or just repackaged lossy audio
  • Mixing and mastering engineers checking for clipping, resonance, or noise floor problems
  • Anyone using the separation tool who wants to check an instrumental for leftover vocal bleed
  • Music learners who want a visual, intuitive sense of how a song is arranged across time and frequency
  • Anyone simply curious what their favourite song looks like as a spectrogram