
How to spot fake lossless music with a spectrogram
How to read a spectrogram to spot fake lossless files: what a high-frequency cutoff means, typical ranges, and when it isn't actually proof.
Why does fake lossless music exist?
'Fake lossless' describes a file that started out as lossy-compressed audio (like an mp3), then got converted or repackaged into a lossless container such as FLAC or WAV to look higher quality than it actually is. Converting the container can't restore data that was already discarded during the original lossy encoding, it only changes the wrapper.
A related trick is upsampling: taking a file with a lower sample rate (one that's already had its high frequencies cut) and converting it to a higher sample rate (96kHz, 192kHz) without adding any genuine high-frequency content. The resulting file is larger and its metadata looks 'hi-res', but the spectrogram still stops exactly where the original source stopped.
How do sample rate, bitrate and the Nyquist frequency affect the frequency ceiling?
For a lossless file sourced from CD-quality audio (44.1kHz/16bit), the theoretical ceiling is the Nyquist frequency: 22.05kHz. In practice, most high-quality recordings have content spread across most of that range, with no hard cutoff partway up.
For mp3 or other lossy formats, most encoders apply a high-frequency cutoff (a brickwall or lowpass filter) to save space, since human hearing is less sensitive to very high frequencies and encoding them accurately costs a lot of bits. The exact cutoff varies by encoder and bitrate settings, there's no single fixed number that holds in every case, but commonly reported typical ranges look roughly like this:
| mp3 bitrate (reference) | Typical cutoff frequency |
|---|---|
| around 128kbps | around 16kHz |
| around 192kbps | around 18 to 19kHz |
| around 320kbps | often close to 20kHz, or no sharp cutoff at all |
These are common reference ranges, not fixed rules. Different encoders, different VBR/CBR settings, and the source recording itself can all produce results that differ from this table. Use it as a rough guide, not an absolute conclusion.
What does a real brickwall cutoff actually look like on a spectrogram?
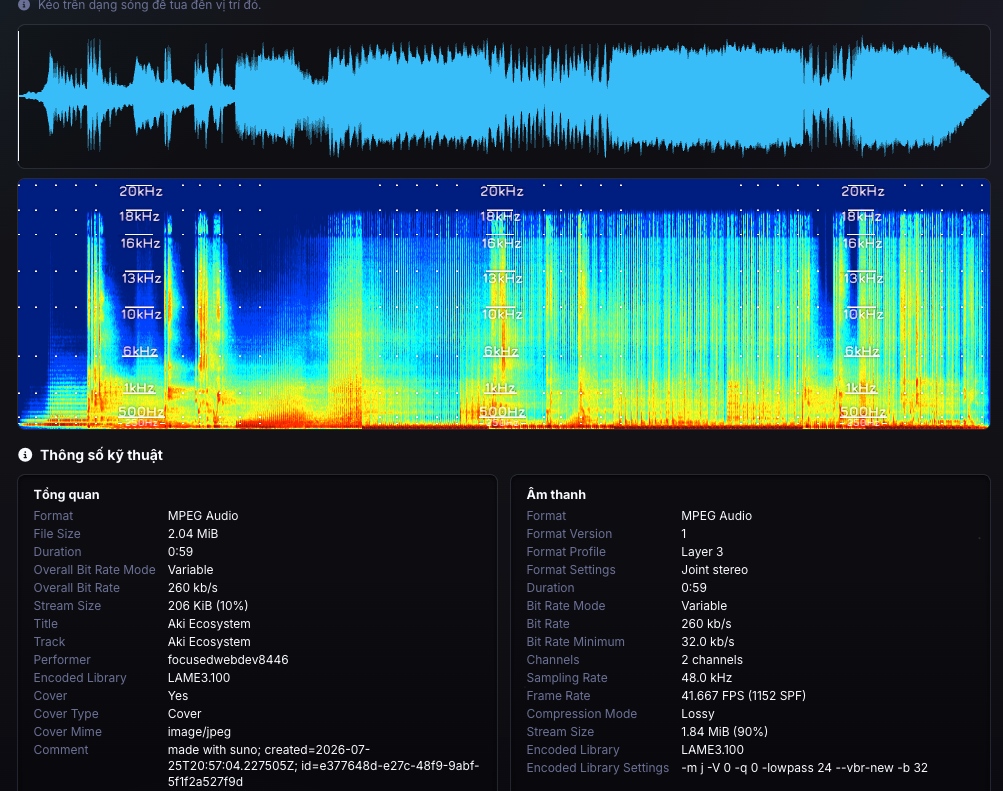
The clearest sign is a boundary that's almost perfectly straight and horizontal, sitting near the top of the spectrogram, with almost nothing above it for the entire track. The term 'brickwall' describes the shape well: energy doesn't taper off naturally as frequency rises, it just stops dead, as if it hit a wall.
By contrast, a genuinely lossless file or a high-bitrate lossy file usually shows energy tapering off gradually at the top, with no sharp flat boundary, extending close to the file's Nyquist frequency. Some near-silence at very high frequencies is completely normal, but if the entire track cuts off hard at exactly the same frequency regardless of what's playing, that's a strong sign of an encoding-imposed cutoff.
Why doesn't a cutoff always prove a file is fake?
This is the part worth being careful about: a cutoff is evidence, not absolute proof. Some genuine masters, especially older recordings made on analog equipment, or certain genres deliberately mixed dark with few high frequencies, can show a natural high-frequency rolloff without ever passing through lossy compression.
Microphones, older mastering chains, or a mix engineer's artistic choices can all produce a spectrogram that's naturally darker at the top than expected. Before concluding a file is fake, combine several signals: is the cutoff a flat brickwall or a gradual natural taper, does the file come from a questionable source, and if you're still unsure, compare it against a known-genuine copy when one is available.
Steps to check a music file with a spectrogram
- Open the file with the spectrogram viewer, drag and drop it directly, nothing to install.
- Look at the top edge of the spectrogram across the entire track, not just the first few seconds.
- Check whether there is a flat boundary that stops abruptly, and note roughly what frequency it sits at.
- Compare that frequency against the reference ranges above to estimate whether the file likely passed through lossy compression.
- Weigh in the file's source and genre before concluding anything, don't rely on a single image alone.
If you want a deeper grounding in reading a spectrogram's axes and colors before applying this check, what is a spectrogram and how to read one is a good place to start.
Primary sources
Is there an exact cutoff frequency that proves a file is fake?
No single number is 100% certain. A cutoff around 16 to 19kHz combined with a flat, brickwall-style boundary is strong evidence of a lossy source, but you should also weigh the file's origin and whether the rolloff is gradual or abrupt before concluding anything.
Is a FLAC file always genuinely lossless?
No. FLAC is just a lossless container format, it's only truly lossless if the audio inside never passed through lossy compression. An mp3 converted to FLAC still carries the frequency cutoff from that original mp3 encoding.