
Reading a spectrogram while mixing: clipping, resonance
How to read a spectrogram while mixing and mastering: spotting clipping, harsh resonance, noise floor issues, and leftover vocal bleed in a separation.
A spectrogram is a diagnostic tool, not just a file checker
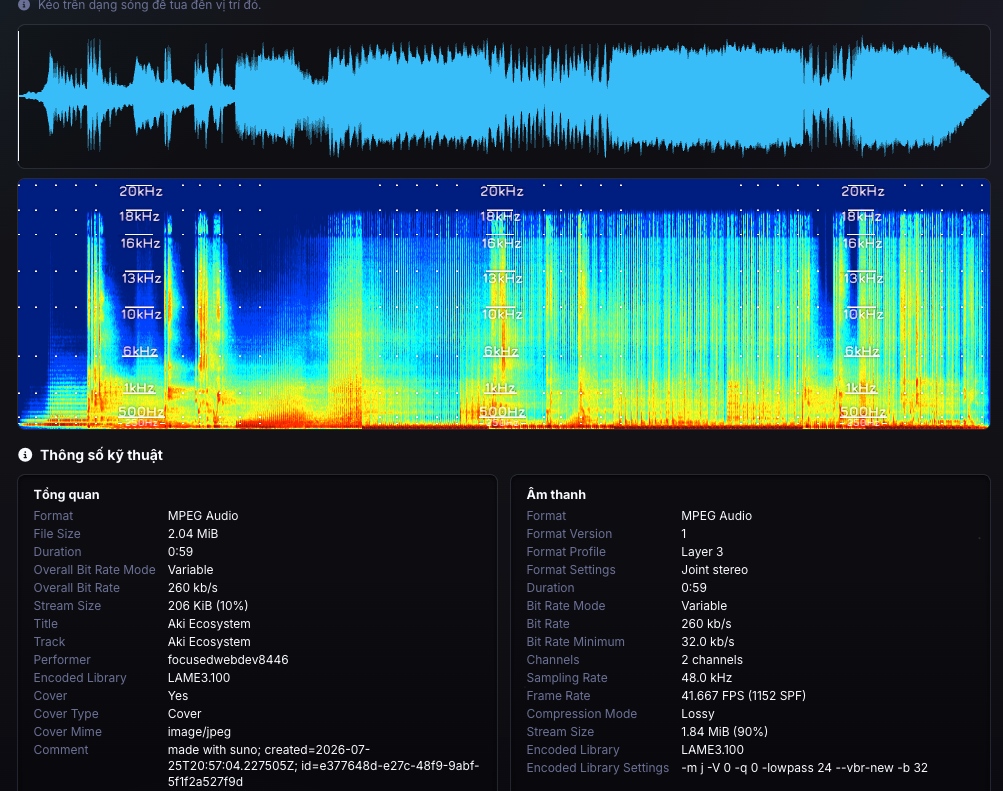
Most people first encounter spectrograms as a way to check whether a music file has been lossy-compressed, see spotting fake lossless music with a spectrogram. But in a studio, a spectrogram is also a daily diagnostic tool: spotting a problem visually before your ears get fatigued from listening to the same section over and over.
The four most common problems a spectrogram helps you catch quickly are: clipping, harsh resonance, an unusually high noise floor, and leftover signal after music separation.
How to spot clipping on a spectrogram
Clipping happens when a signal's amplitude exceeds the maximum level a system can capture, flattening the peaks instead of letting them round off naturally. On a waveform, the tell is flat-topped peaks, easy to spot once you zoom in.
On a spectrogram, clipping produces harmonic distortion that spreads across the entire frequency range right at the moment it happens, usually visible as a sudden vertical smear of noise, including frequencies the original music never had. If you see an unusual bright smear appear exactly when a section gets loudest, even at very high frequencies no instrument was actually playing at, that's a strong sign of clipping.
Finding resonance and harsh frequencies while mixing
Resonance is when one specific frequency rings unusually loud compared to everything around it, often caused by the room, an instrument, or an EQ or reverb decision. On a spectrogram, it shows up as a persistent bright line sitting at one exact frequency, running continuously or recurring throughout the track, standing out clearly from its neighbors.
Unlike resonance, a single instrument note only lights up for the moment it actually rings and then fades. Genuine resonance tends to exist regardless of what instrument is playing, like an annoying constant running through the whole mix. Pinpointing that frequency on a spectrogram makes an EQ cut far more precise than trying to find it by ear alone.
Judging the noise floor with a spectrogram
The noise floor is the background noise present in every recording, from electrical hum in the gear to microphone hiss to room noise. On a spectrogram, it shows up as a faint, even haze across the entire frequency range, most visible during quiet passages between vocal lines or before an instrument enters.
An unusually high noise floor, especially one that's noticeably denser in the mid and high frequencies, is often a sign of lower-quality recording gear, gain set too high, or a room without good acoustic treatment. The narrower a track's dynamic range (the gap between its quietest and loudest moments), the more exposed the noise floor becomes, since there's less headroom for it to hide under the main signal.
Checking a separation result with a spectrogram
When you use a separation tool to pull out a beat or isolate an instrument, a spectrogram is the fastest way to judge the result without listening through every section by ear. Open the instrumental after separation with the spectrogram viewer, and look for faint patterns that follow the rhythm and pitch of the original melody even though the vocal was supposedly removed. That's leftover vocal bleed, a common technical limit of every separation tool available today, not specific to any one tool, see removing vocals from a song for more.
- A faint pattern tracking the melody in the mid and high frequencies: the clearest sign of leftover vocal.
- The instrumental thinning out exactly where the vocal was loudest: a sign the model 'borrowed' instrument energy.
- Compare the spectrogram of a 2-stem result against a 4-5 stem result on the same song to pick the cleaner one.
Quick reference: what to look for and where
| Problem | What it looks like on a spectrogram |
|---|---|
| Clipping | A sudden broadband smear, including frequencies with no instrument present |
| Resonance | A persistent bright line sitting at one exact frequency |
| High noise floor | A faint, even haze across the whole frequency range, clearest in quiet passages |
| Lossy cutoff | A flat boundary near the top that stops abruptly |
| Vocal bleed after separation | A faint pattern following the original melody inside the instrumental |
Primary sources
Can a spectrogram replace listening by ear while mixing?
No. A spectrogram just helps you quickly spot where to pay attention; the final call on how to treat a sound still needs real listening. It's a diagnostic aid, not a replacement for your ears.
How do you tell real resonance apart from a normal instrument note on a spectrogram?
Genuine resonance sits continuously at one exact frequency regardless of what's playing, like a constant running through the whole mix. A single instrument note only lights up for the moment it rings and fades with the melody.